
Using Theissen polygons to interpret rainfall data
The best method for calculating the rainfall over a catchment or aquifer area using data from a number of rain gauges was proposed by Theissen (1911). First, plot the rain gauge locations on a map and then draw a series of straight lines to join the adjacent rain gauges. Next, draw perpendicular lines to bisect the lines joining each rain-gauge, and extend them to form a series of polygons as shown in the diagram. Catchment rainfall is calculated by taking the average rainfall for each polygon as being equal to value measured by the rain-gauge at its centre. This method is much more accurate than a simple arithmetic mean of all the rain gauges in the area.
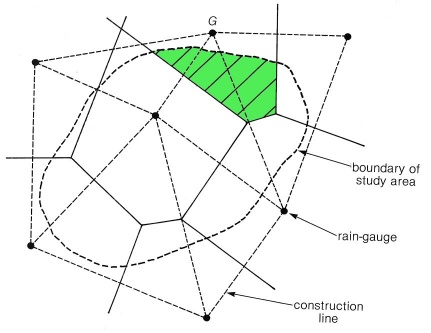
The total volume of rainwater falling on the catchment (or study area) is calculated by
multiplying the depth of rainfall at each rain-gauge with the area of its polygon that
falls inside the catchment. For example, the volume of rain falling on the portion of
the catchment coloured green is taken to be the depth of rain measured at rain-gauge 'G',
multiplied by the area. If the depth of rain is say, 355mm and the area is 2,465m2, the
volume is 0.355 x 2465 = 875,075m3. Repeat this type of calculation for each
polygon and then add them together to obtain the total value for the catchment.
Reference
Theissen, A.H. (1911) Precipitation for large areas. Monthly Weather Review, Volume 39,
Pages 1082-1087
This Handy Hint is based on information in my book Field Hydrogeology.
Copyright © 2004 by Rick Brassington
|